The new DB Alert Log metric
Since the Oracle Enterprise Manager database plugin version 12.1.0.4, there is a new metric “DB Alert Log” available. This metric replaces the existing “Alert Log” metric. The benefit of the new plugin is if an ORA error is detected multiple times in the database alert log based on same error stack, it will be de-duplicated and only one metric alert is generated. Oracle’s recommendation is to replace this metric on the database targets – Changes to the Metric Alert Log Monitoring in Database Plug-in 12.1.0.4 and later (Doc ID 1587020.1).
How to create such metrics and many more is very well described in Kellyn Pot’Vin blog post serie http://dbakevlar.com/2013/08/em12c-enterprise-monitoring-part-i/
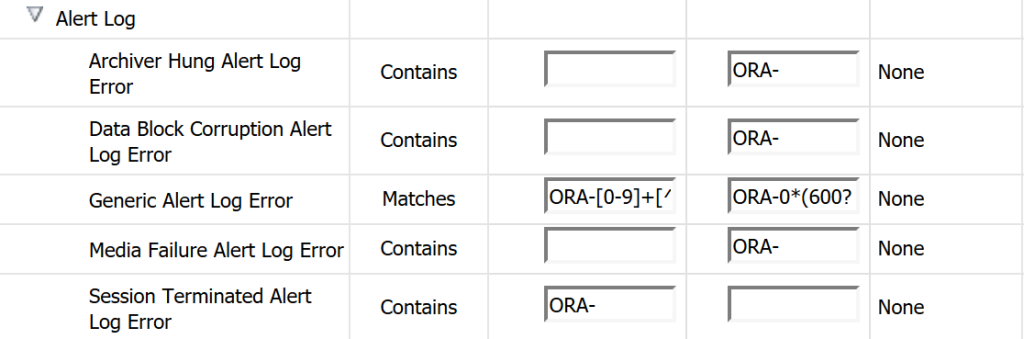
The old metric Alert Log:
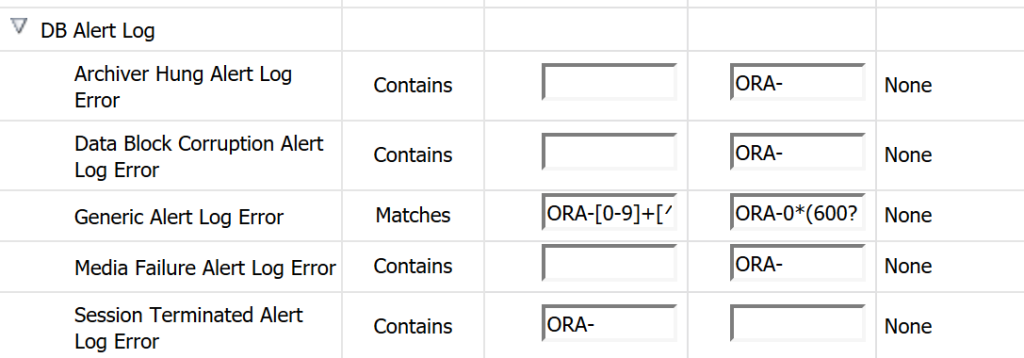
The new metric DB Alert Log:
In use the following thresholds for ORA- errors:
- Critical alerts for ORA-600 and 7445
- Warning alerts for all other ORA- errors
A basic Monitoring Template
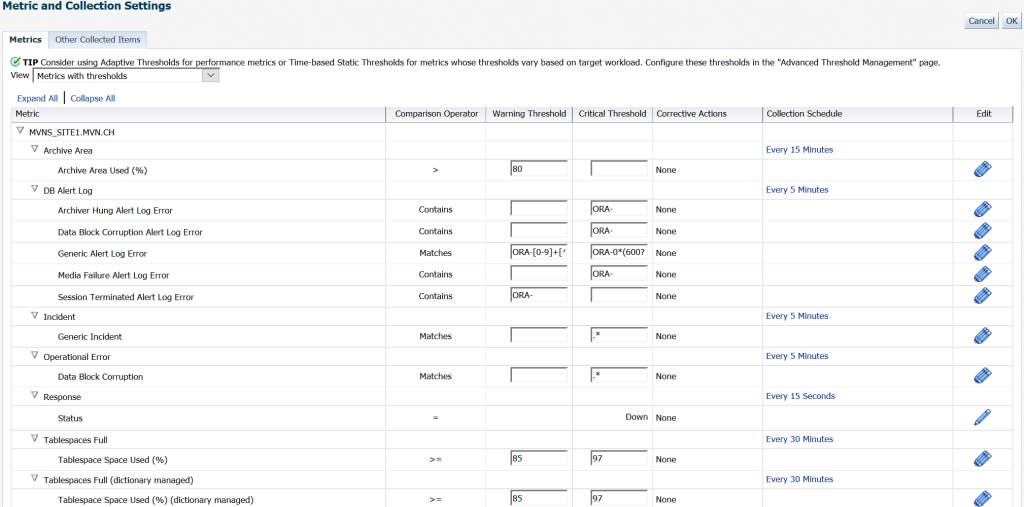
To make my DBA job easier, I have created a basic template which monitors me the most important things. Sure, there are many more things what you can verify in EM13c, but I wanted to keep it simple. Feel free to extend your monitoring templates.
| Metric | Comparison Operator | Warning Threshold | Cricital Threshold | Collection Schedule | |
| Archive Area | Archive Area Used (%) | > | 80 | Every 15 Minutes | |
| DB Alert Log | Alert Log Error Trace File | Every 5 Minutes | |||
| Alert Log Name | |||||
| Archiver Hung Alert Log Error | Contains | ORA- | |||
| Data Block Corruption Alert Log Error | Contains | ORA- | |||
| Generic Alert Log Error | Matches | ORA-[0-9]+[^0-9] | ORA-0*(600?|7445)[^0-9] | ||
| Media Failure Alert Log Error | Contains | ORA- | |||
| Session Terminated Alert Log Error | Contains | ORA- | |||
| Time/Line Number | |||||
| Incident | Generic Incident | Matches | .* | Every 5 Minutes | |
| Operational Error | Data Block Corruption | Matches | .* | Every 5 Minutes | |
| Response | Status | = | Down | Every 15 Seconds | |
| Tablespaces Full | Tablespace Space Used (%) | >= | 85 | 97 | Every 30 Minutes |
| Tablespaces Full (dictionary managed) | Tablespace Space Used (%) (dictionary managed) | >= | 85 | 97 | Every 30 Minutes |
XML for Import
If you like to use this metric, you can download the XML here: db_monitoring_template_1.0 – just save the code as XML and import the metric in your Oracle EM13c Enterprise Manager.
Verification
After deploying of the template to the targets, verify on the target databases that a) the template is deployed and b) that the collection is enabled.Go to Oracle Database – Monitoring – Metric and Collection Settings (click on image for better view):
Useful My Oracle Support Notes
- EM 12c, EM 13c: Database Alert Log Monitoring in Enterprise Manager Cloud Control and Alert Log Metrics Explained (Doc ID 1538482.1)
- Changes to the Metric Alert Log Monitoring in Database Plug-in 12.1.0.4 and later (Doc ID 1587020.1)
- Enterprise Manager Oracle Database Plug-in Metric Reference Manual