
Do you know steampipe.io by Turbot? When you search for steampipe.io you will get this answer: “Steampipe is an open-source tool to instantly query your cloud services like AWS, Azure….” And this looks like a perfect match for my Oracle Cloud Infrastructure account. With steampipe.io and simple SQL query syntax, you can gather data from your account like running compute instances, block volume used and so on. The tool supports a large number of vendors like Zoom, Splunk, GitHub and many more, not only the cloud providers. From the technical perspective, a PostgreSQL foreign data wrapper extension (FDW) is used to get data from the specified API, in this case the API from Oracle Cloud Infrastructure.
Sure, for Oracle Cloud Infrastructure all this information is available by using OCI CLI too. But steampipe.io provides a PostgreSQL database in the background where you can select your data with a psql client. Additionally, a CIS scan module is available to verify your account and a dashboard called “Insights”. The tool is based on OCI IAM where you can control the access settings. If you have ever done an OCI CLI setup, the configuration will be an easy task for you. If not, just follow the steps on my GitHub page – just klick on the image:
![]()
The running PostgreSQL database can be used for further data processing. For the full setup go to the public Github project called OCI-Monitoring where the link is above. It is an Ansible automated OCI monitoring setup where all required components are installed running on Oracle Linux 8. Steampipe.io is used there to gather information about running compute instances and used block volumes to show later in a Grafana dashboard.
Steampipe Links
- Steampipe | select * from cloud;
- Oracle Cloud Infrastructure plugin | Steampipe Hub
- Oracle Cloud Infrastructure Compliance mod | Steampipe Hub
- Dashboards | Oracle Cloud Infrastructure Insights mod | Steampipe Hub
The Architecture
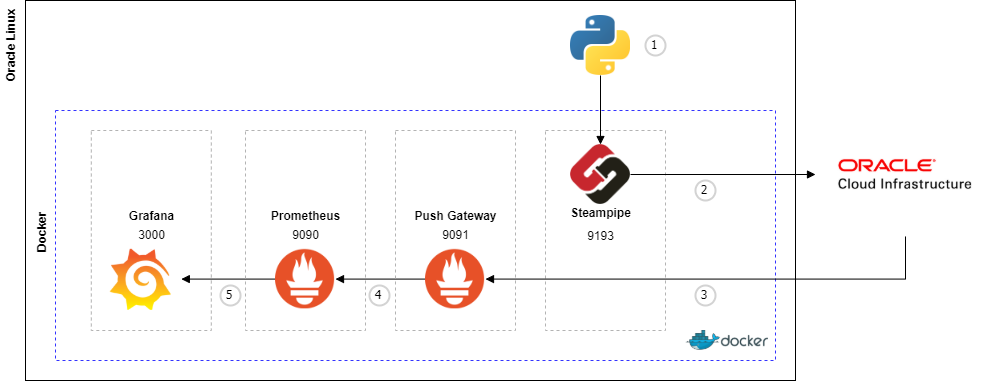
- Execute Python script against steampipe.io by SQL syntax
- Steampipe gathers the information from Oracle Cloud Infrastructure
- The return value is pushed by the Python script to Prometheus Pushgateway
- Prometheus scrapes the metric from the Pushgateway
- Grafana reads the metric from Prometheus data source
Steamipe.io Example Queries
Query 1 – Running Instances
select display_name,shape,region from oci_core_instance where lifecycle_state='RUNNING';
+--------------------------+---------------------+-------------+
| display_name             | shape               | region      |
+--------------------------+---------------------+-------------+
| osms-server-win-01       | VM.Standard.E4.Flex | eu-zurich-1 |
| osms-server-ol7-01       | VM.Standard.E4.Flex | eu-zurich-1 |
| osms-server-ol8-01       | VM.Standard.E4.Flex | eu-zurich-1 |
| ci-automation-manager    | VM.Standard.E4.Flex | eu-zurich-1 |
+--------------------------+---------------------+-------------+
Query 2 – Block Volume Summary
SELECT sum(size_in_gbs) from oci_core_volume where lifecycle_state='AVAILABLE';
+------+
| sum  |
+------+
| 2048 |
+------+
Query 3 – Home Region
select key,title,status from oci_region where is_home_region=true;
+-----+-------------+--------+
| key | title       | status |
+-----+-------------+--------+
| ZRH | eu-zurich-1 | READY  |
+-----+-------------+--------+
Combine steampipe.io and Pushgateway with Python
import psycopg2
from prometheus_client import CollectorRegistry, Gauge, push_to_gateway
from prometheus_client import Summary

uri = f'{{ steampipe_connect_string }}'

try:
    con = psycopg2.connect(uri)
    print(f'Connected to DB.')

    try:
        cur = con.cursor()
        cur.execute('select count(*) from oci_core_instance where lifecycle_state=\'RUNNING\';')
        print('Query ran')
    except:
        print('Query failed')
        raise
    else:
        ci_summary = cur.fetchone()[0]
        print(ci_summary)

        if ci_summary is None:
          ci_summary = 0

        registry = CollectorRegistry()

        g = Gauge('oci_compute_running_summary', 'OCI Compute Running Summary', registry=registry)
        g.set(int(ci_summary))
        push_to_gateway('{{ ansible_default_ipv4.address }}:9091', job='oci_compute', registry=registry)

    finally:
        con.close()
        print(f'Connection closed.')
except Exception as e:
    print('Something went wrong:', e)
What’s next?
Steamipe.io is the Swiss Army knife for information gathering from different sources. In my case, Prometheus and Grafana are used for persistency and visualization. Any comments and inputs on the GitHub page are very welcome. As my next task, I will write more queries to fill up my dashboard – hopefully, I find time during X-mas holidays 🙂 – and I will provide you with some information “Insights” and the compliance scans.
This project I have started a long time ago, and now I had time to finalize it – have fun!