In a previous blog post I wrote about monitoring Oracle Cloud Infrastructure components by Grafana. In the meantime, we got the Oracle Cloud Free Tier. Here is an updated version.
This blog post shows you how to install and configure the Grafana plugin based on the Oracle blog entry https://blogs.oracle.com/cloudnative/data-source-grafana on an Oracle Enterprise Linux 8 server.
Steps to monitor the Oracle Cloud Free Tier by the OCI Grafana Plugin
- Install and configure the Oracle Cloud Infrastructure CLI – by download or by YUM install
- Configure Group, User and Policy in Oracle Cloud Infrastructure Console
- Install Grafana and the OCI Plugin
- Configure the Grafana DataSource
- Create a new Dashboard with OCI Metrics
Machine Requirements
The server needs access to the internet.
Install and configure the Oracle Cloud Infrastructure CLI
Link: https://docs.cloud.oracle.com/iaas/Content/API/SDKDocs/cliinstall.htm
In this step, the software will be installed an configured. The new created SSH public key has to be added in the OCI console for further actions.
As OS user root we create a new user for OCI actions.
# groupadd oci
# useradd oci -g oci
# passwd oci
Login as user oci, execute the CLI download and installation script. Answer questions with Y / Enter to get the default installation.
$ bash -c "$(curl -L https://raw.githubusercontent.com/oracle/oci-cli/master/scripts/install/install.sh)"
Default values:
| install directory | /home/oci/lib/oracle-cli |
| executable directory | /home/oci/bin |
| OCI scripts | /home/oci/bin/oci-cli-scripts |
| optional CLI packages | db |
| shell/tab completion | Y |
| path to rc file | /home/oci/.bashrc |
After the successful CLI installation, you have to configure it.
$ /home/oci/bin/oci setup config
Based on your OCI account, these information are required – let the config and key location on default values.
| config location | /home/oci/.oci/config |
| user OCID | OCI > Identity > Users > [YOUR_USER] > OCID |
| tenancy OCID | OCI > Administration > Tenancy Details > [YOUR_TENANCY] > OCID |
| region | choose your region, e.g. eu-zurich-1 |
| generate a new key pair | Y -> only if you don’t have already created a key pair |
| key directory | /home/oci/.oci |
| key name | oci_api_key |
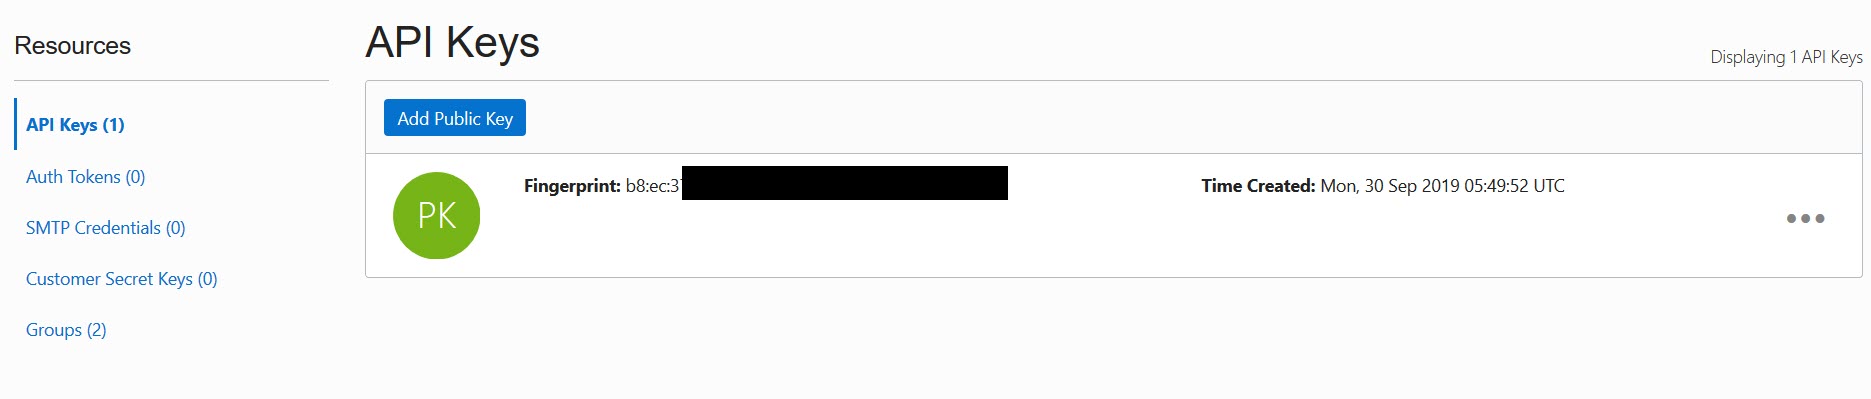
Add the content of the public key file in the OCI console to your user which you want to work with.
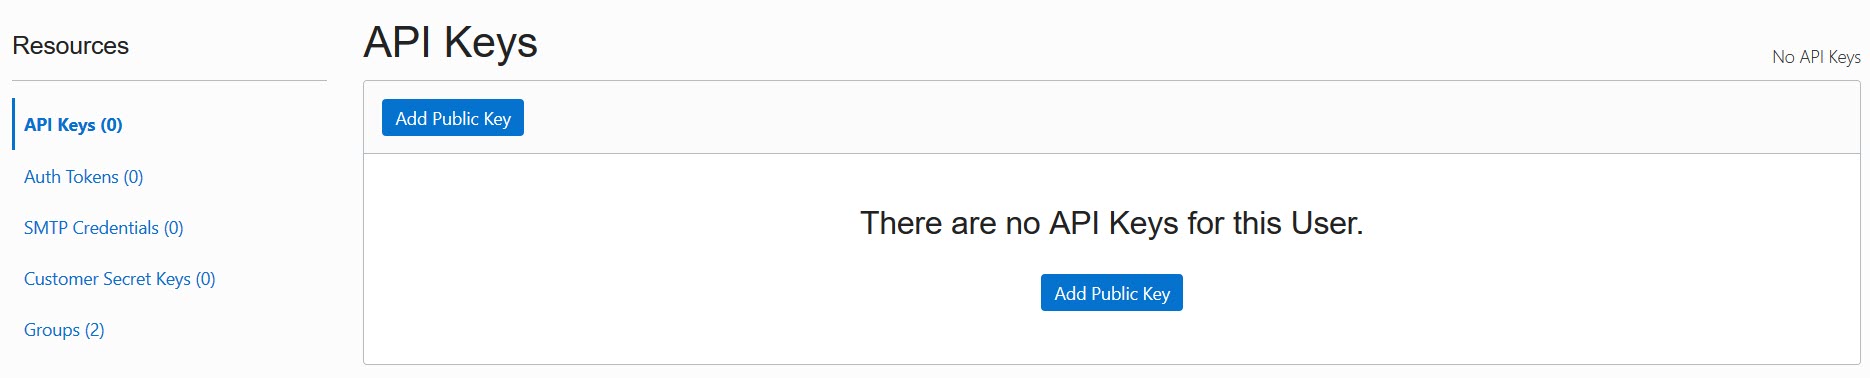
Attention: Be sure that you add the public key to the user which you have used for the CLI configuration!
Test the CLI configuration – example to list all compartments in your tenant.
$ /home/oci/bin/oci iam compartment list --all | grep name
      "name": "ManagedCompartmentForPaaS",
      "name": "Mohnweg",
Alternative Method Oracle Linux 7 – YUM Repository
Thanks to Sergio Leunissen from Oracle for his input, the Python SDK and oci utilities are is available in the YUM repository too and ready to install. Take a look at his blog post to see how to work with the Python SDK and OCI metadata:
Configure Group, modify User and add a Policy in Oracle Cloud Infrastructure Web Interface
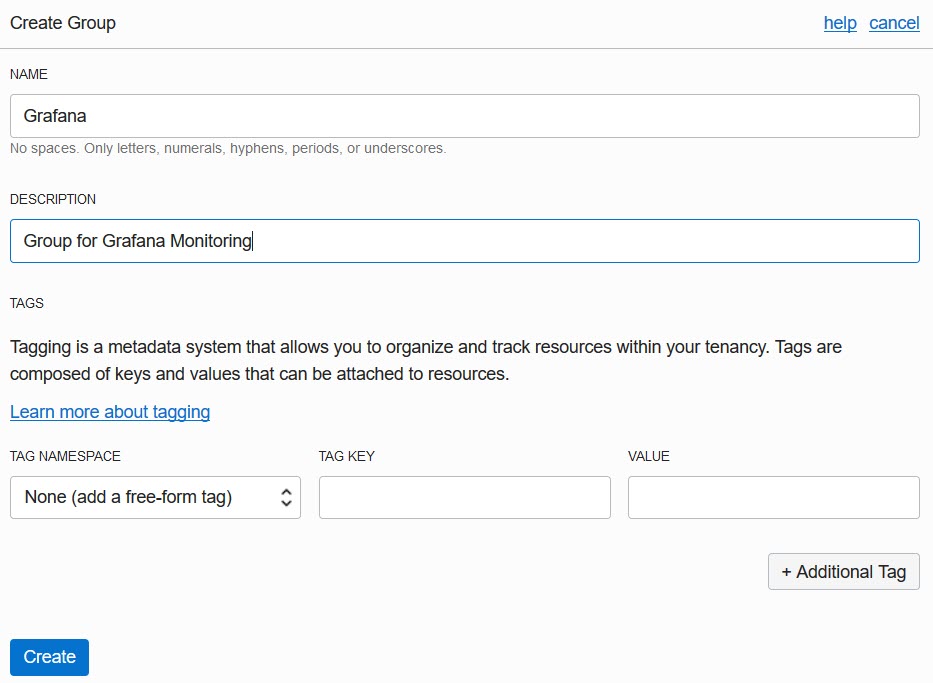
Group
Create a new OCI group called Grafana. OCI > Identity > Groups.
Modify User
Add the selected user to the group – for example this is my user.

Add a Policy
Create a new policy called GrafanaPolicy. OCI > Identity > Policies.
allow group grafana to read metrics in tenancy
allow group grafana to read compartments in tenancy

Install Grafana and the OCI Plugin
Link: https://grafana.com/grafana/download?platform=linux
Login as user root and install Grafana.
# wget https://dl.grafana.com/oss/release/grafana-6.3.6-1.x86_64.rpm
# yum localinstall grafana-6.3.6-1.x86_64.rpm
Enable auto start and start the Grafana server manually.
# systemctl enable grafana-server.service
# systemctl daemon-reload
# systemctl start grafana-server
Enable port 3000 (Grafana default port in firewall – the port can be changed in /etc/grafana/grafana.ini) to provide web access to Grafana.
# firewall-cmd --permanent --zone=public --add-port=3000/tcp
# firewall-cmd --reload

# firewall-cmd --permanent --zone=public --list-ports
3000/tcp
Install the Grafana Oracle Cloud Infrastructure oci-datasource plugin.
# grafana-cli plugins install oci-datasource
# service grafana-server restart
Verify the Grafana plugin directory with the installed plugin.
# ls -la /var/lib/grafana/plugins
total 0
drwxr-xr-x. 3 grafana grafana 28 Sep 30 08:05 .
drwxr-xr-x. 4 grafana grafana 50 Sep 30 08:04 ..
drwxr-xr-x. 3 root    root    18 Sep 30 08:05 oci-datasource
Grafana needs the configuration file and the SSH Key from the user oci. As user root, copy the files and set the ownership to OS user grafana.
# cp -r /home/oci/.oci /usr/share/grafana
# chown -R grafana:grafana /usr/share/grafana/.oci
Change the path to the key file in /usr/share/grafana/.oci/config.
# vi /usr/share/grafana/.oci/config
From:
key_file=/home/oci/.oci/oci_api_key.pem
To:
key_file=/usr/share/grafana/.oci/oci_api_key.pem
Create a new Dashboard based on OCI Metrics
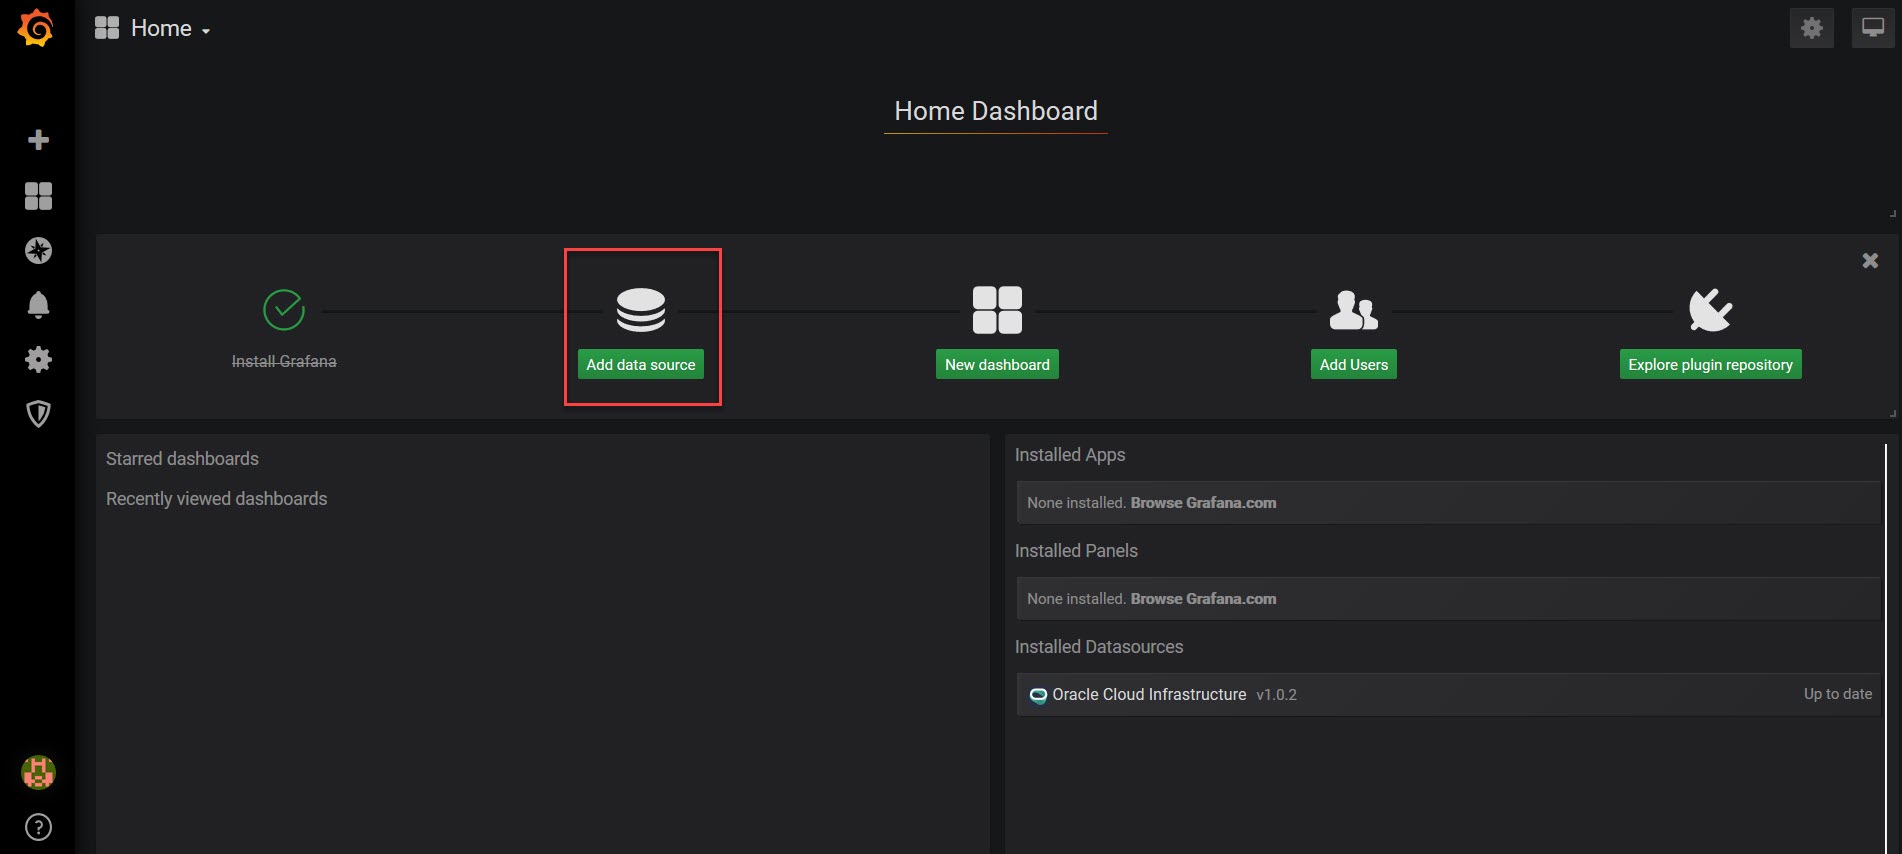
Open your browser and log in into Grafana with [SERVERNAME]:3000. Username and password are admin/admin. You have to change your initial password imme diately.

Add data source
Select Oracle Cloud Infrastructure

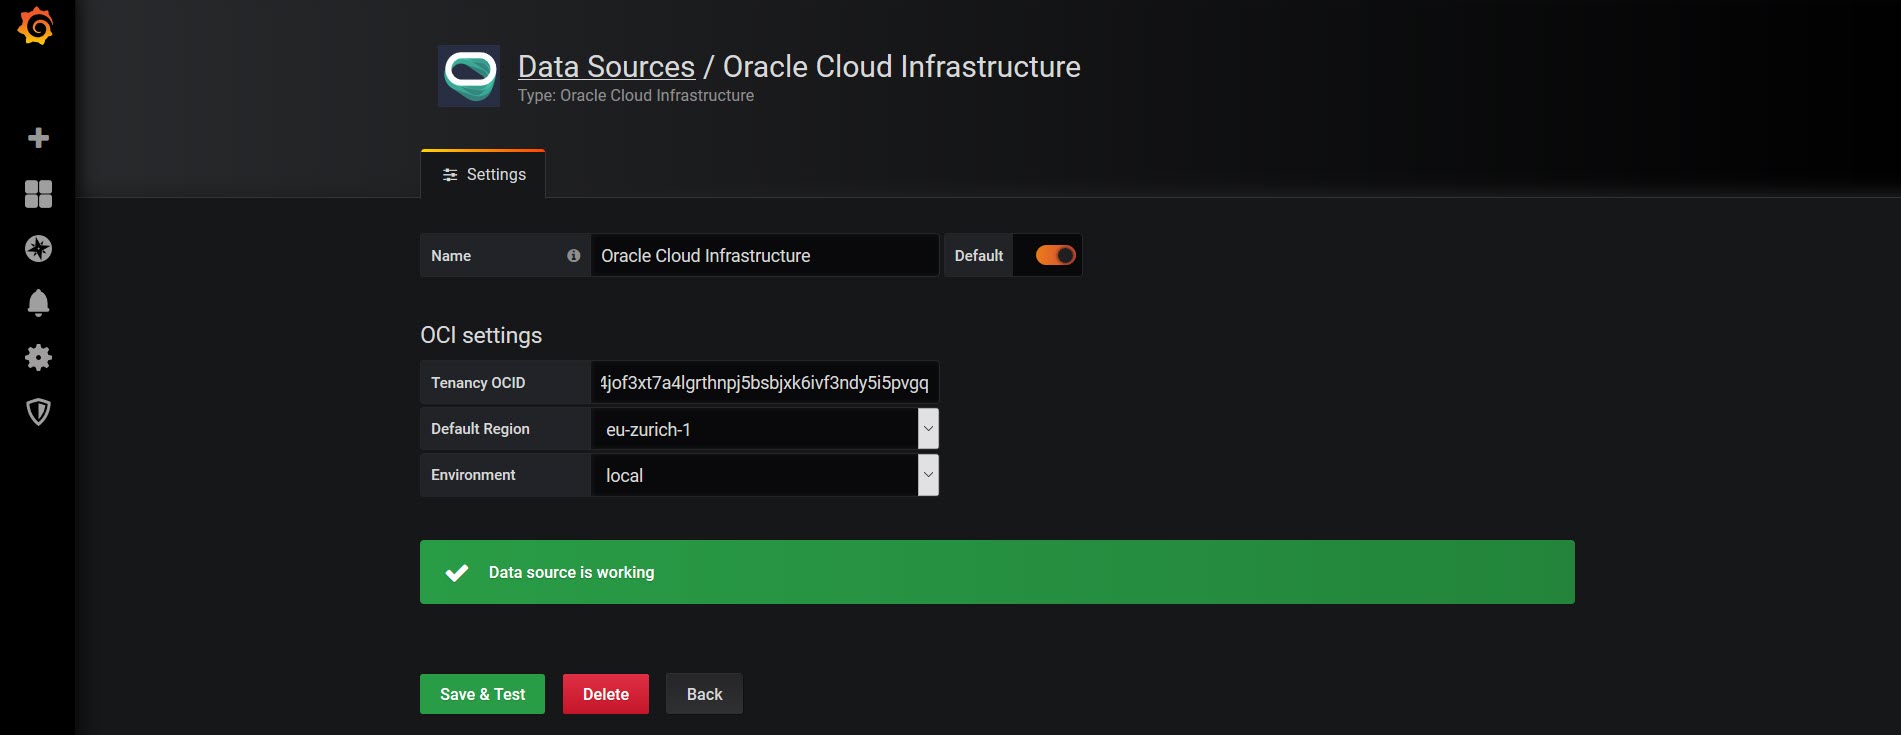
Configure the Data Source
Fill in your tenancy OCI, region and set Environment = Local. Test the connection. For troubleshooting see Grafana logfile in directory /var/log/grafana. If your default region like ZRH / EU-ZURICH-1 is not listed, then you have to edit the a plugin file as described below. Otherweise no metrics are shown.
Example to use Grafana for the Datacenter eu-zurich-1:
Edit the file /var/lib/grafana/plugins/oci-datasource/dist/constants.js and add your missed region – restart Grafana.
_export('regions', regions = ['ca-toronto-1', 'eu-frankfurt-1', 'uk-london-1', 'us-ashburn-1', 'us-phoenix-1','eu-zurich-1']);
Error message in the grafana.log when your region is not added in file content.js but you select the region as data source:
{ RawResponse={400 Bad Request 400 HTTP/1.1 1 1 map[Content-Length:[105]
 Content-Type:[application/json] Date:[Mon, 30 Sep 2019 06:21:25 GMT]
Opc-Request-Id:[777d41435b6f545f2aab5f1e10d9f278/15461D7746D5EAD60CC00B46095A5BDE/FD316A5328D8FD17D0B68205CF5C80F4]]
0xc0004c64c0 105 [] false false map[] 0xc0 00150800 0xc000133b80} Items=[]
OpcRequestId=<nil> }\n: Service error:InvalidParameter. token recognition error at
: '$'\n $metric[1m].max()\n . http status code: 400. Opc request id: 777d41435b6f545f2aab5f1e10d9f278/15461D7746D5
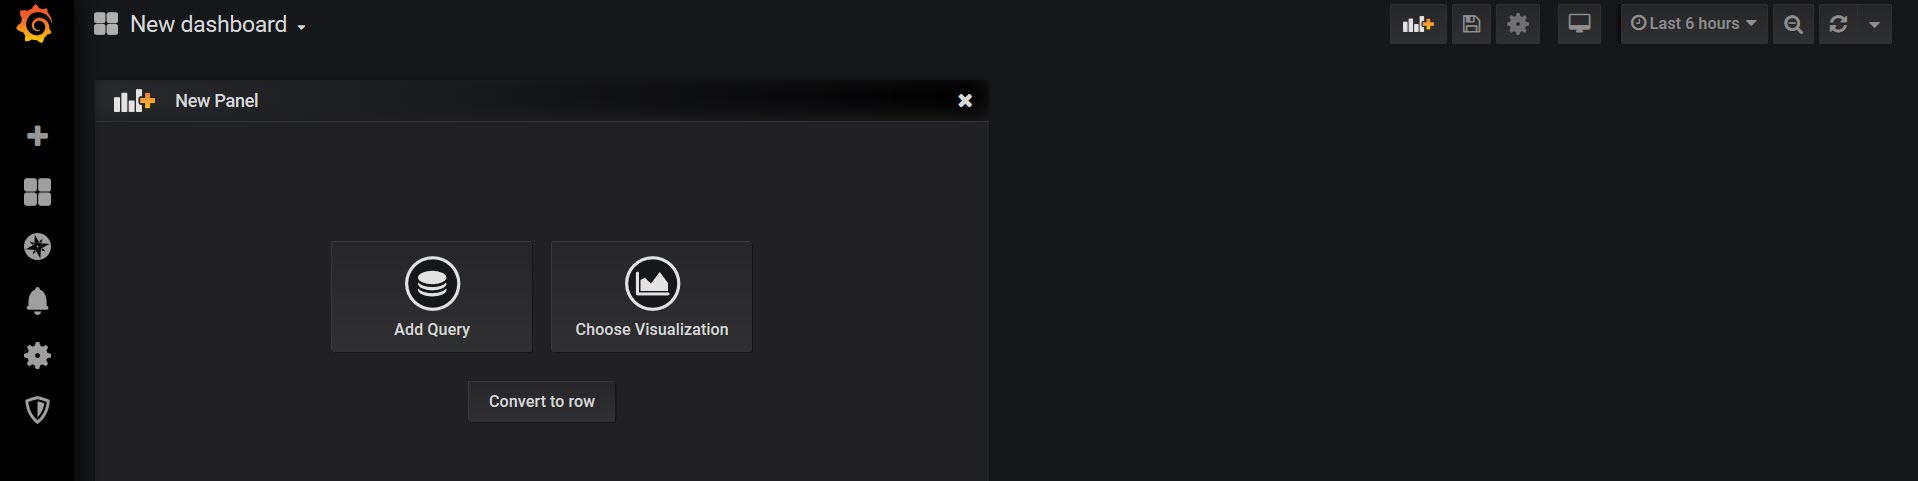
Create a new Dashboard and Add Query
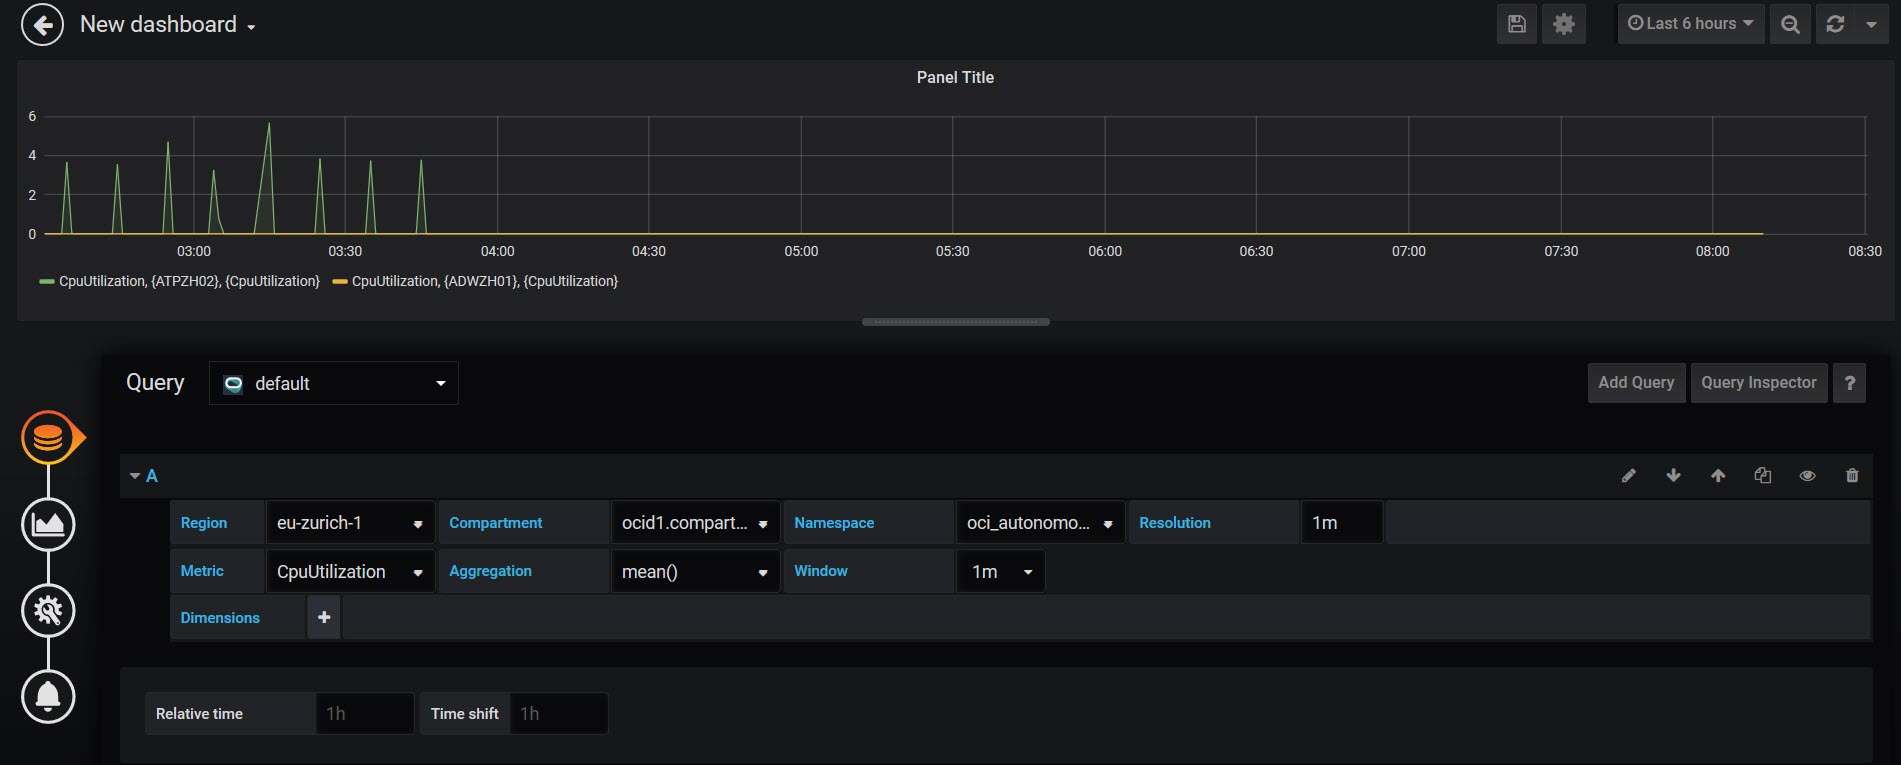
Create a Query to visualize Data
In this dashboard example I used the region eu-zurich-1, my compartment, the namespace oci_autonomous_database and the metric CpuUtilization.
There are a lot of other metrics available like:
- CurrentLogons
- ExecutionCount
- Sessions
- StorageUtilization (in %)
- etc.
Available Metrics
Learn more about metrics and monitoring in the OCI documentation here:
Summary
The OCI Grafana plugin is a nice solution to visualize your Oracle Cloud Free Tier environment based on Open Source software. Take care, Grafana needs access to the OCI CLI SSH information for the Oracle Cloud Infrastructure connection.